Explore these resources to enhance your understanding of statistical concepts and methods.
Hypothesis Testing in R (R Code Examples)
This interactive resource presents one-sample and two-sample hypothesis testing examples in R. Covers raw-data and summary statistics examples for Z-tests, T-tests, pooled and unpooled (Welch's) two-sample tests, paired tests, and non-parametric tests. Designed for beginners in R-programming in an introductory probability and statistics course.
Format: Interactive HTML (Hosted on GitHub)
View Hypothesis Testing R Code
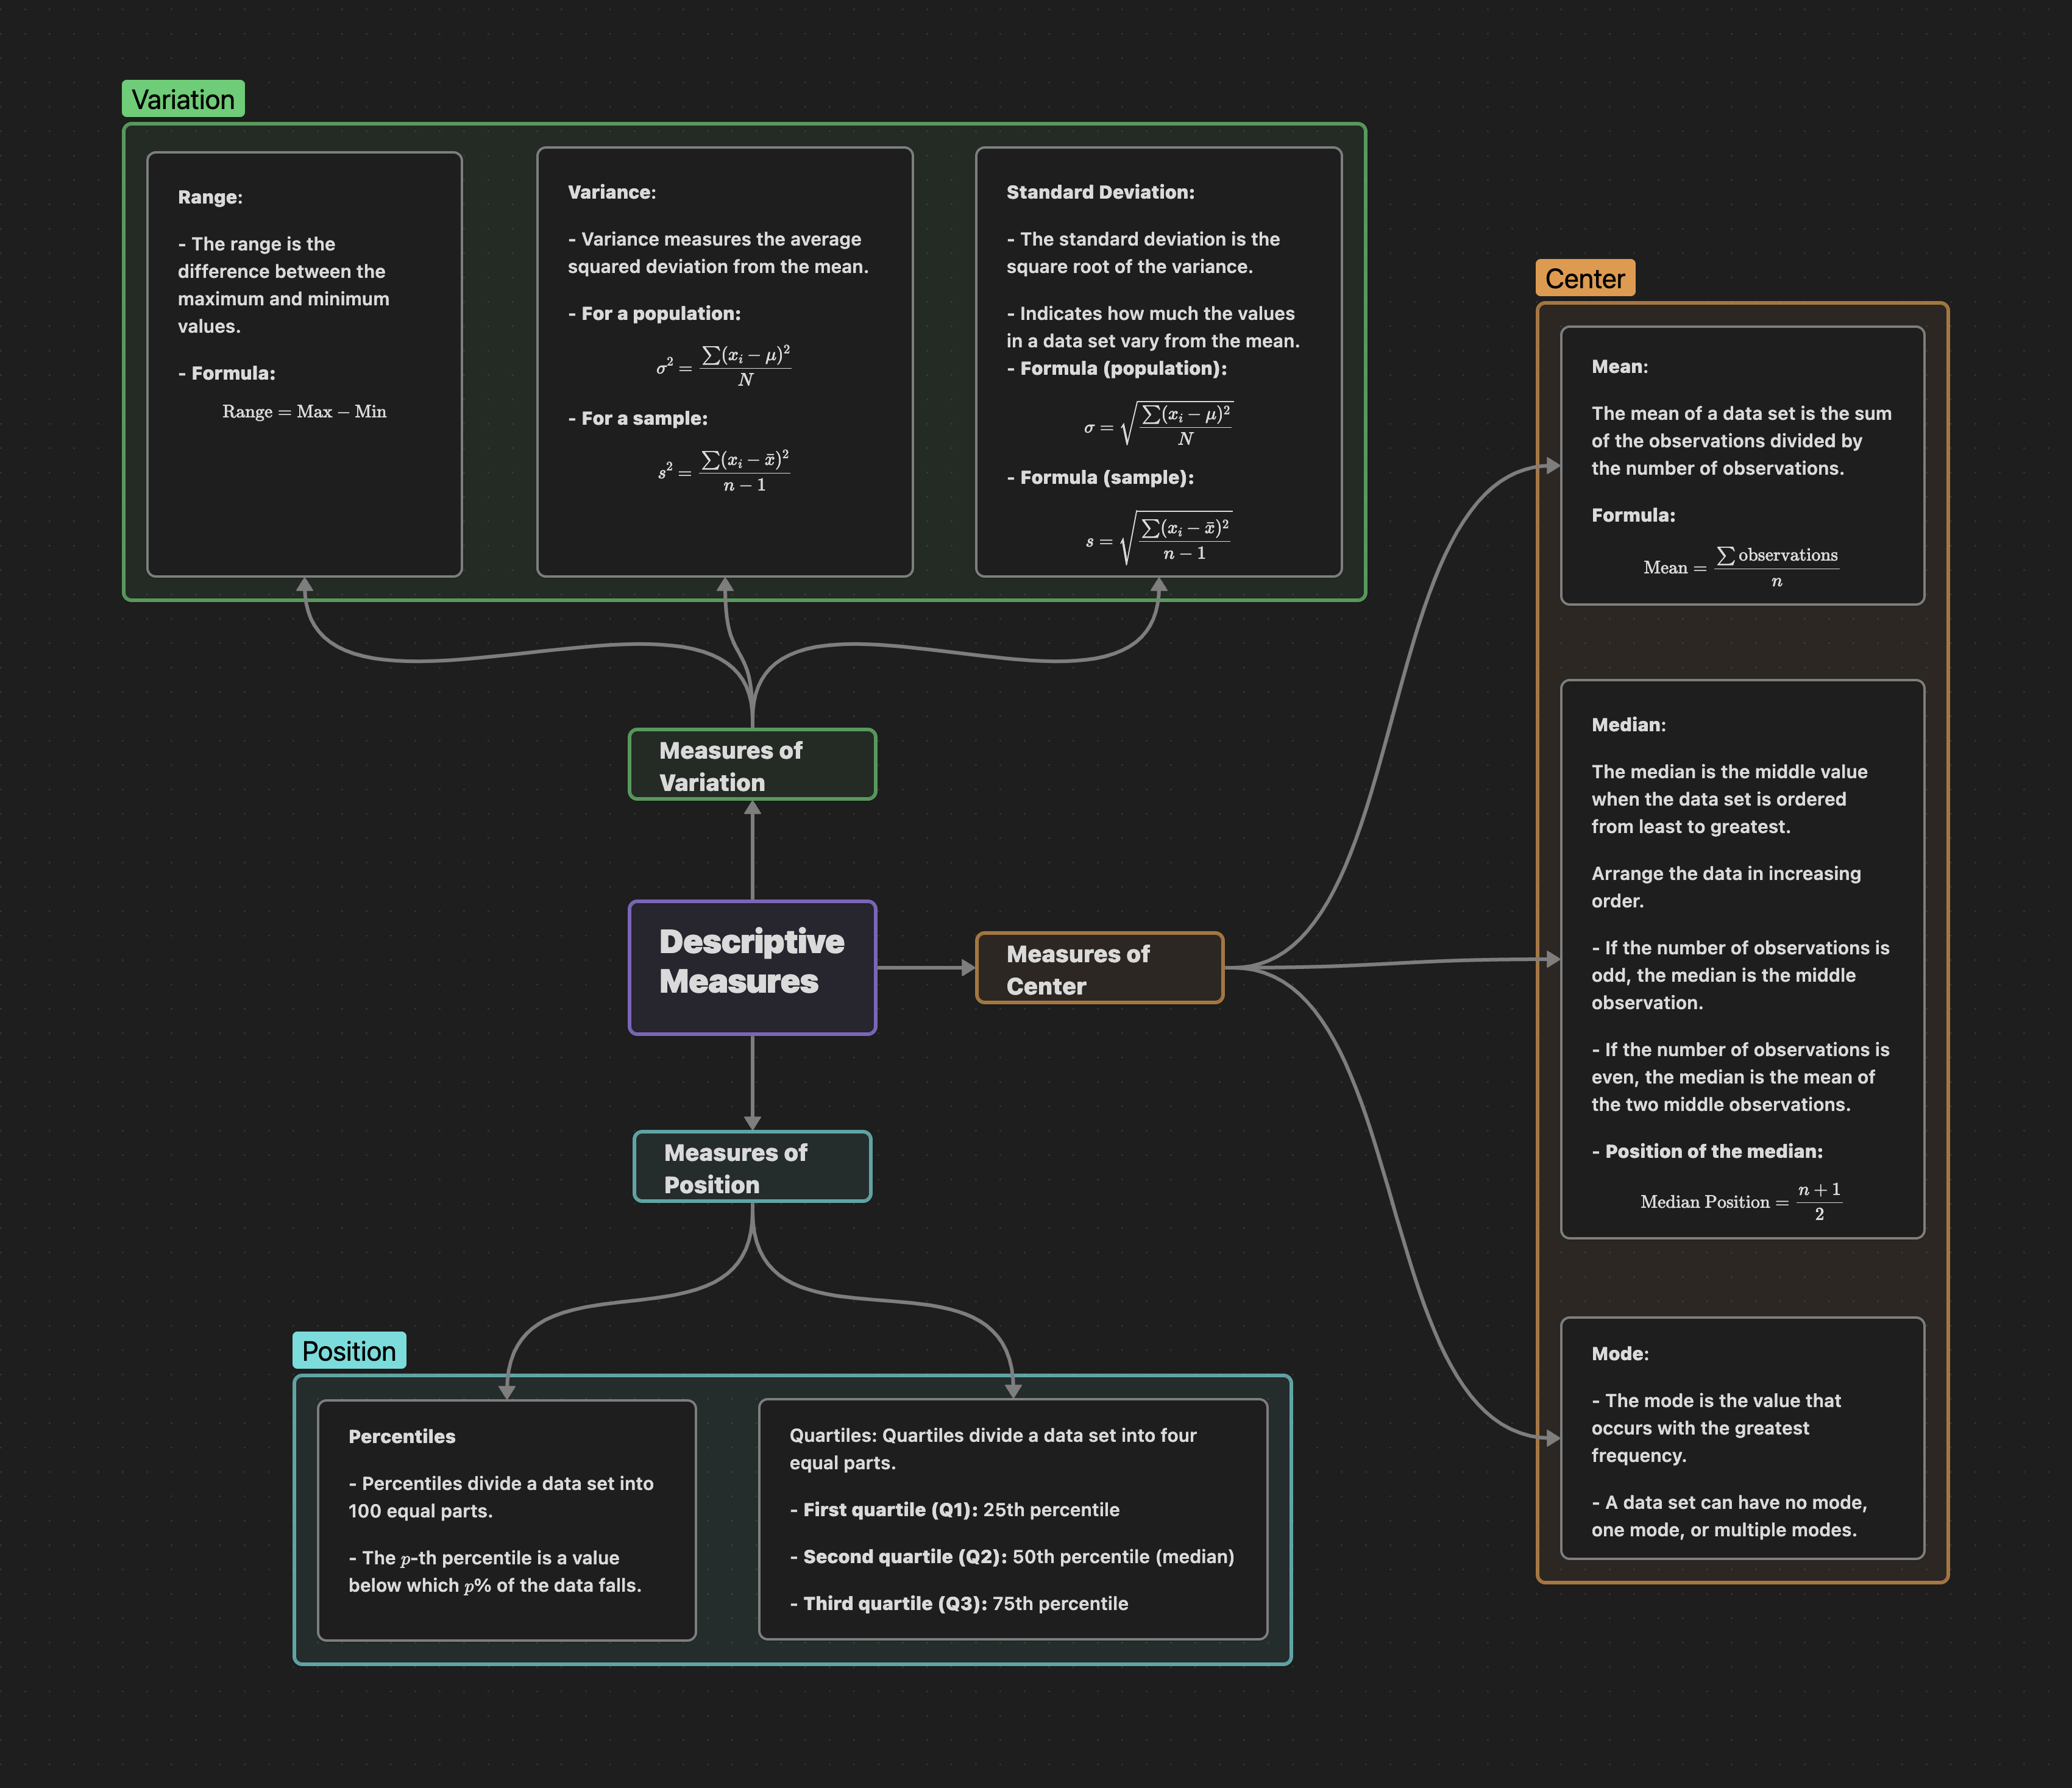
Descriptive Measures Overview
A concise overview of key descriptive statistics, including mean, median, mode, and standard deviation.
Format: Overview Image
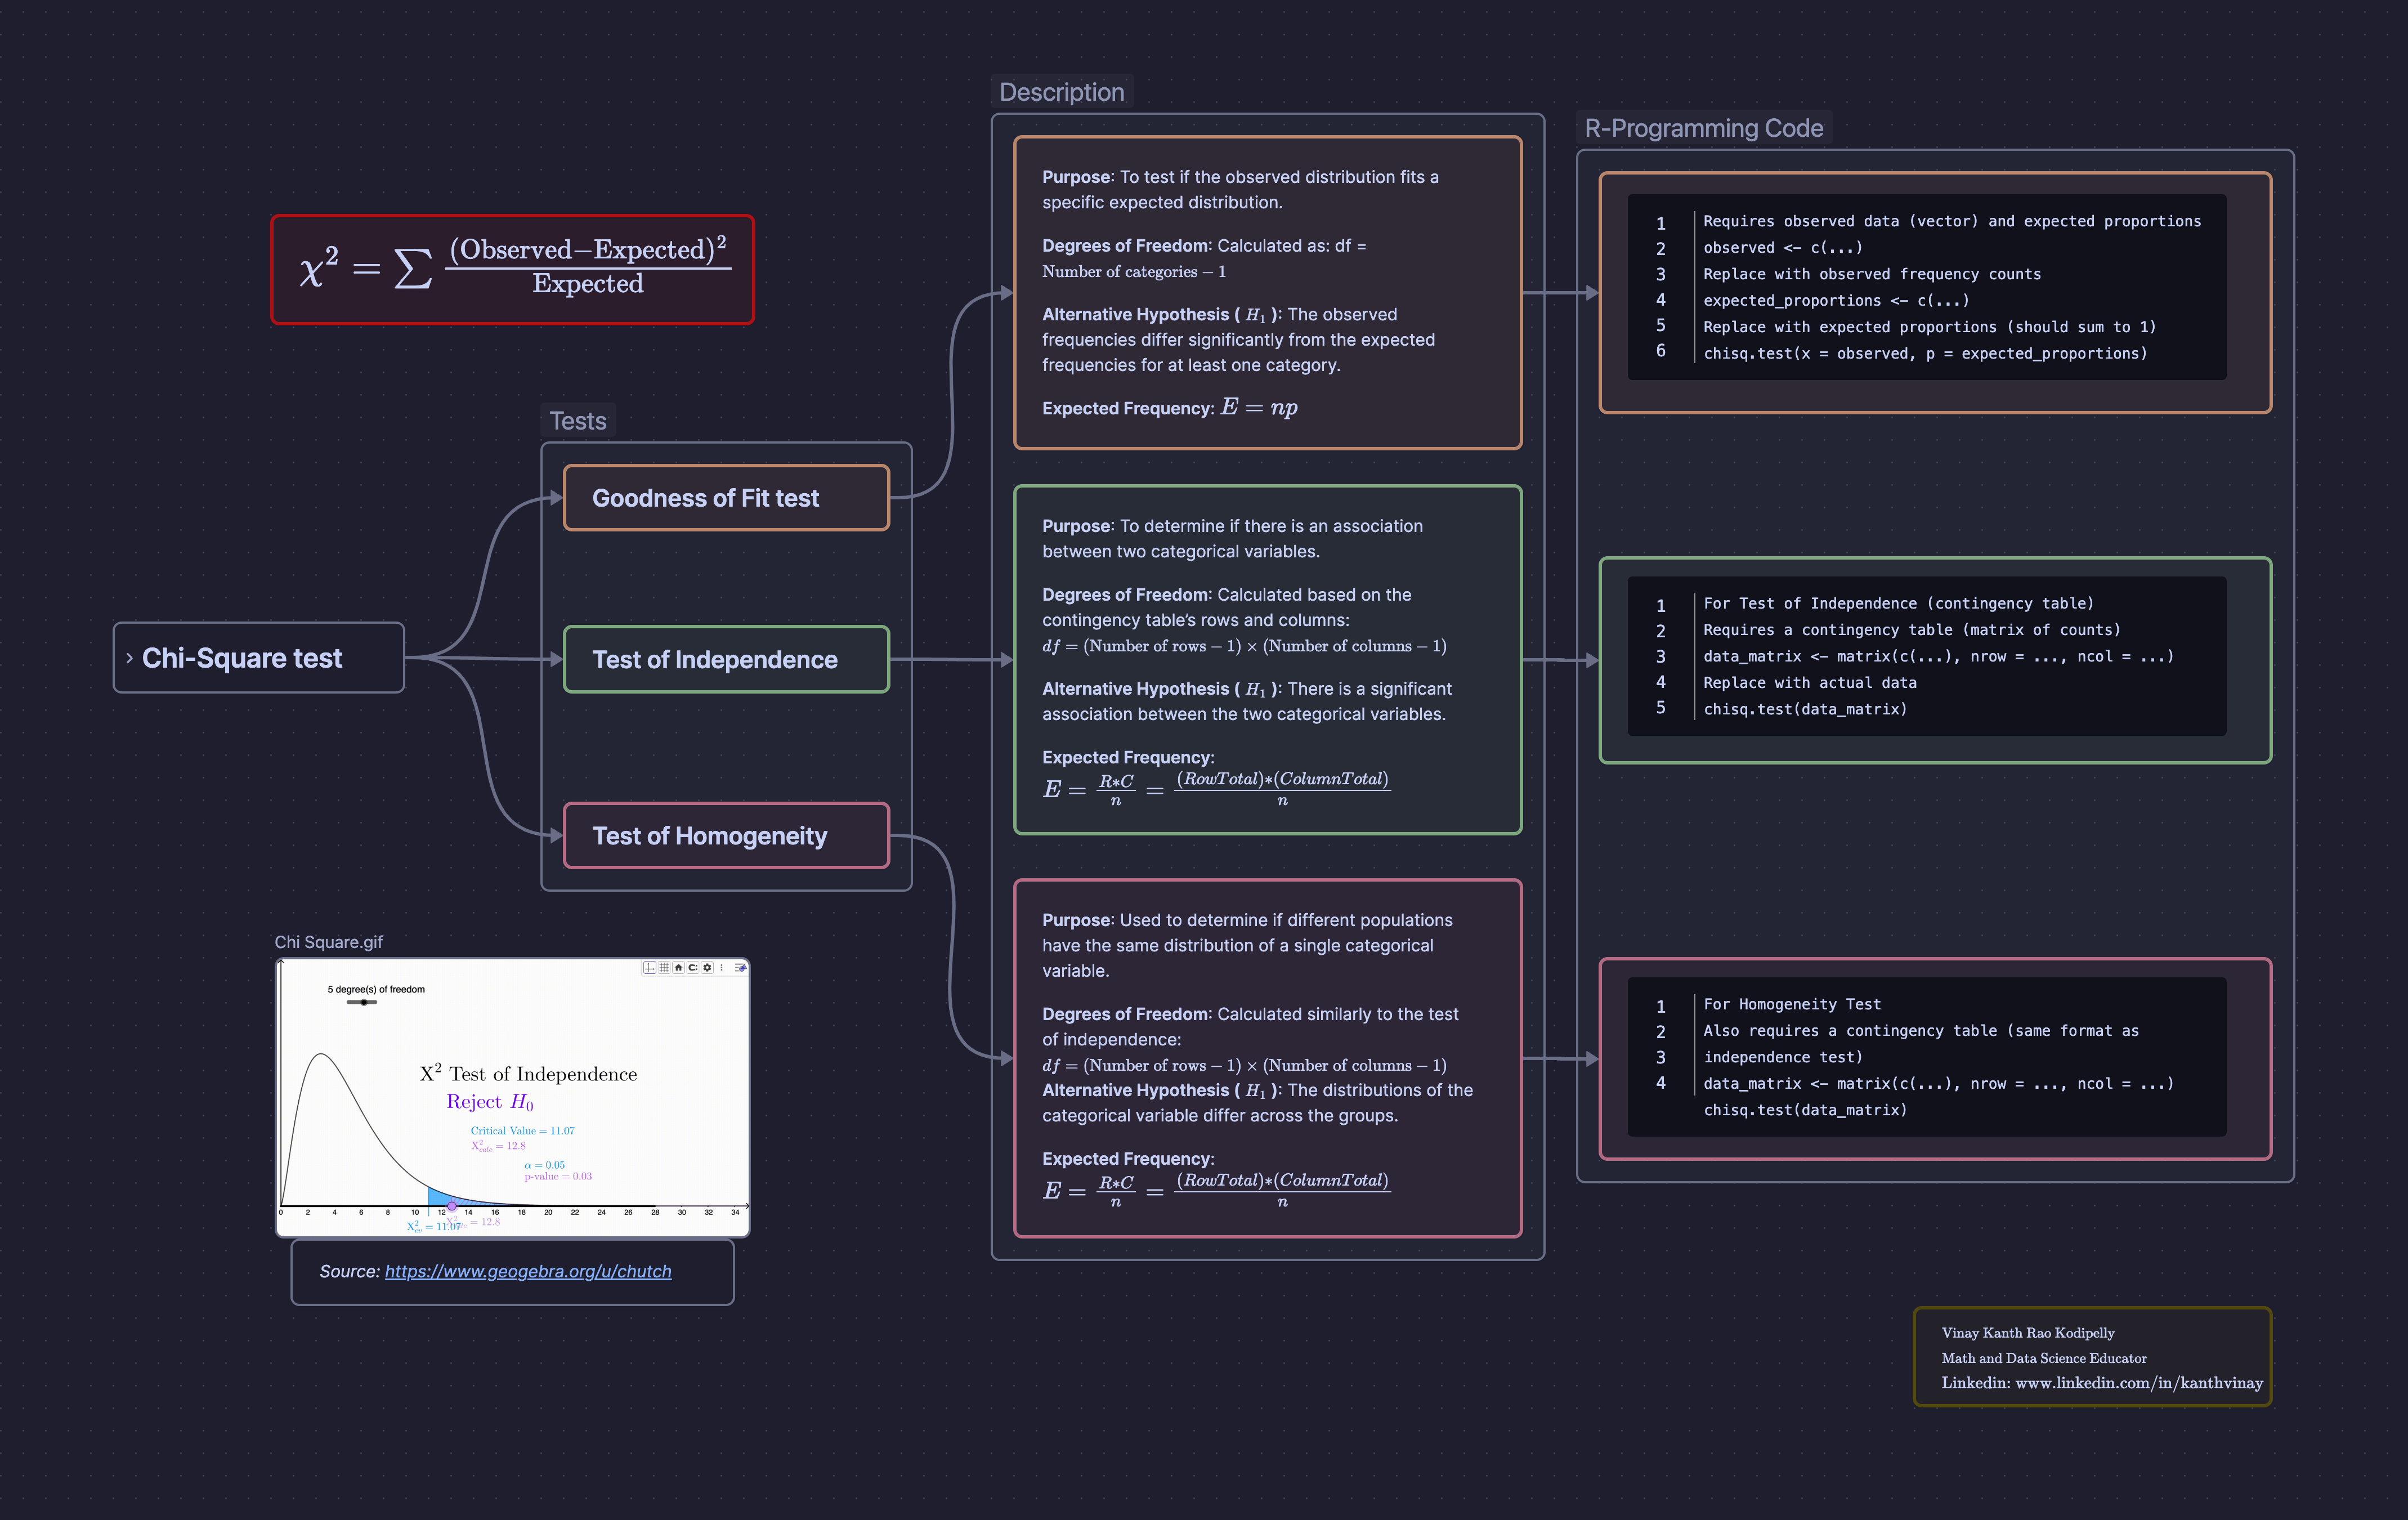
Chi-Square Test Overview
Introduction to the Chi-Square test, its applications, and how to interpret results.
Format: Overview Image
Normal Distribution Lecture Notes (with R Code)
Comprehensive lecture notes on the normal distribution, including properties, applications, and R code examples for analysis.
Format: Lecture Notes (PDF)
📥 Download PDF
Hypothesis Testing & Confidence Intervals for Proportions
Beginner-friendly, step-by-step lecture notes on statistical inference for population proportions. Covers confidence intervals, margin of error, sample size calculation, and hypothesis testing for one and two proportions. Includes R code examples and real-world interpretation tips.
Format: Interactive HTML
🖥️ Open Lecture Notes
Linear Regression Lecture Notes
Clear, beginner-focused lecture notes explaining simple linear regression concepts, interpretation of slope, intercept, R-squared, and hypothesis testing in regression, with R examples.
Format: Interactive HTML
🖥️ Open Lecture Notes
Chi-Square Test Lecture Notes
Lecture notes on the Chi-Square tests for independence and goodness-of-fit with R-code examples.
Format: Interactive HTML
🖥️ Open Lecture Notes
Analysis of Variance (ANOVA) with R Examples
Comprehensive guide to One-Way ANOVA including F-distribution theory, assumptions checking, implementation in R, and post-hoc analysis using Tukey's HSD. Features interactive visualizations and real-world examples.
ANOVA
R Code
Interactive
Lecture Notes
Format: Interactive HTML with R Code
📊 Open ANOVA Guide